Research
Phylogenetics and phylogenomics
The lab has several projects focused on phylogenetics and phylogenomics. This includes exploring phylogenomic approaches such as in this paper, as led by Alexa and Eric, along with phylogenomic analyses such as those conducted by Holly and Tomi. One specific area is examining gene tree conflict and its role in our studies, both from analyzing the support for species relationships and gaining a deeper understanding of the biological implications of conflict. Recently, Holly found bias in the number of genes supporting morphological convergence compared to an equally evolutionary relationship; more info here. Holly also developed a program to help with analyses, available here.
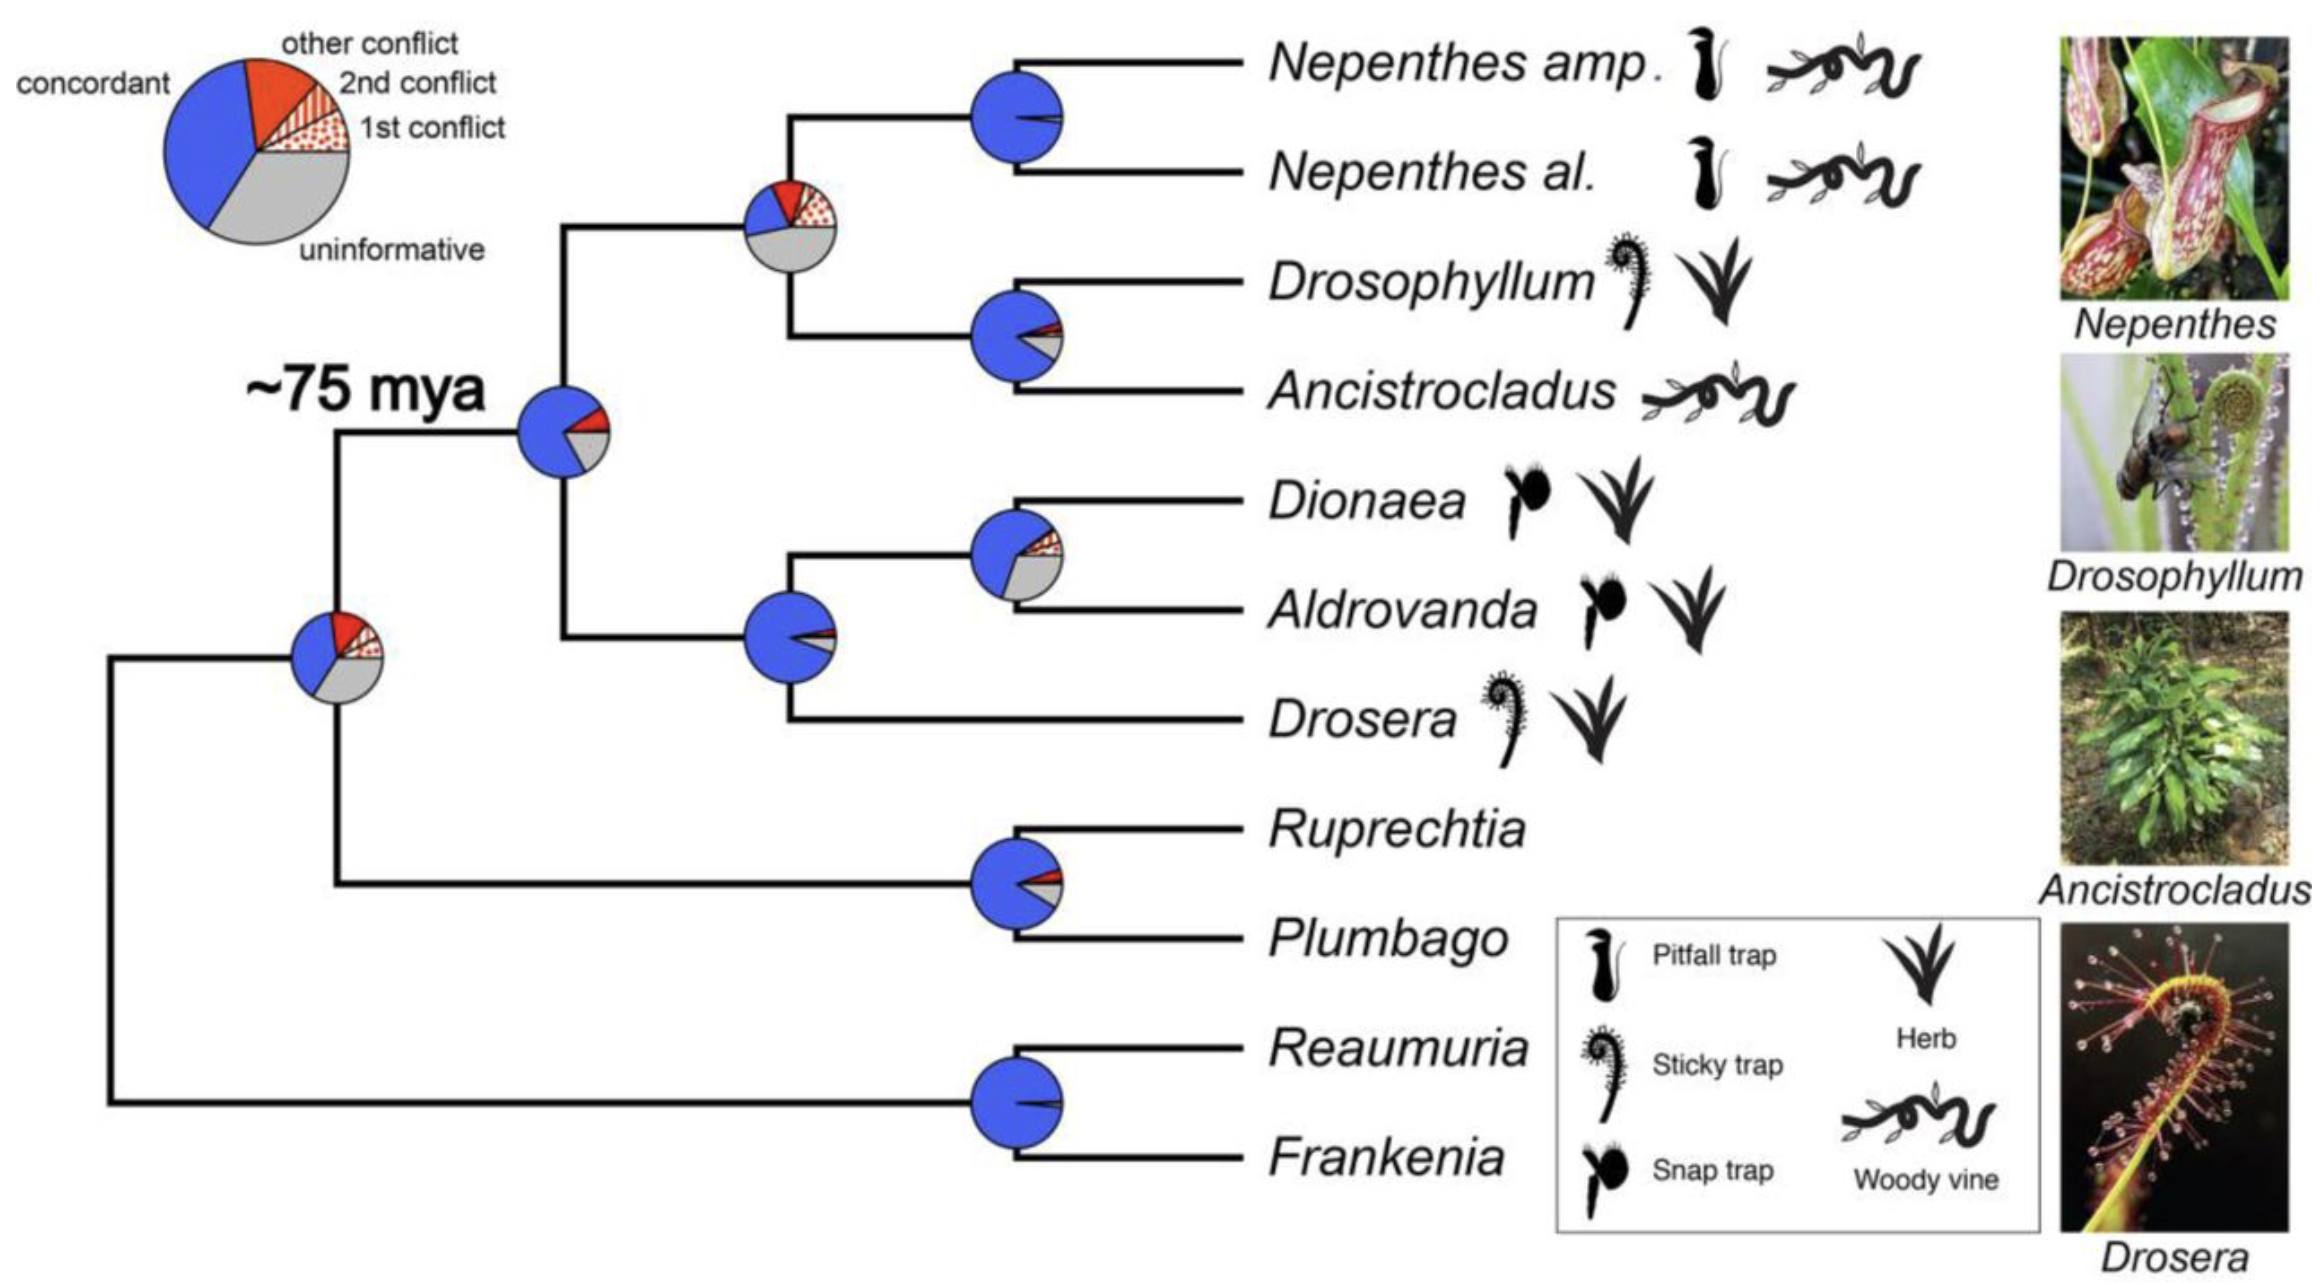
This image is from Holly’s paper. Pie charts depict the amount of gene tree conflict observed, with the blue, red and grey slices representing, respectively, the proportion of homolog gene trees concordant, conflicting and uninformative (SH-alrt < 80 or missing taxon) at each node in the species tree. In case of conflict, the proportions of gene trees supporting two main alternative topologies are represented with a dotted or a striped red slice, respectively. The proportion of gene trees supporting various alternative topologies is represented with a solid red slice. The type of trap found in each carnivorous species, as well as the herbaceous or woody life history, is depicted with a symbol on the right of the phylogeny. Picture credit: Drosophyllum lusitanicum (incidencematrix), Ancistrocladus heyneanus (Vinayaraj) and Drosera capensis (NoahElhardt) via Wikimedia Commons.
Obtaining and analyzing transcriptomic data
The lab has been focused on obtaining transcriptomes from tissue that hasn’t been preserved for this purpose. Natalia, a graduate student in Robie’s lab, conducted a thesis chapter in the lab where she extracted RNA from silica-preserved tissues. We hope to refine protocols and methods to obtain transcriptomes from as many tissues as possible so herbaria collections can help fill the sampling gap. Alexa’s putting together a review on the bias that current transcriptome sampling produces and what we may do to alleviate these biases. We’ve also examined how transcriptome data may be applied to population genetics questions.
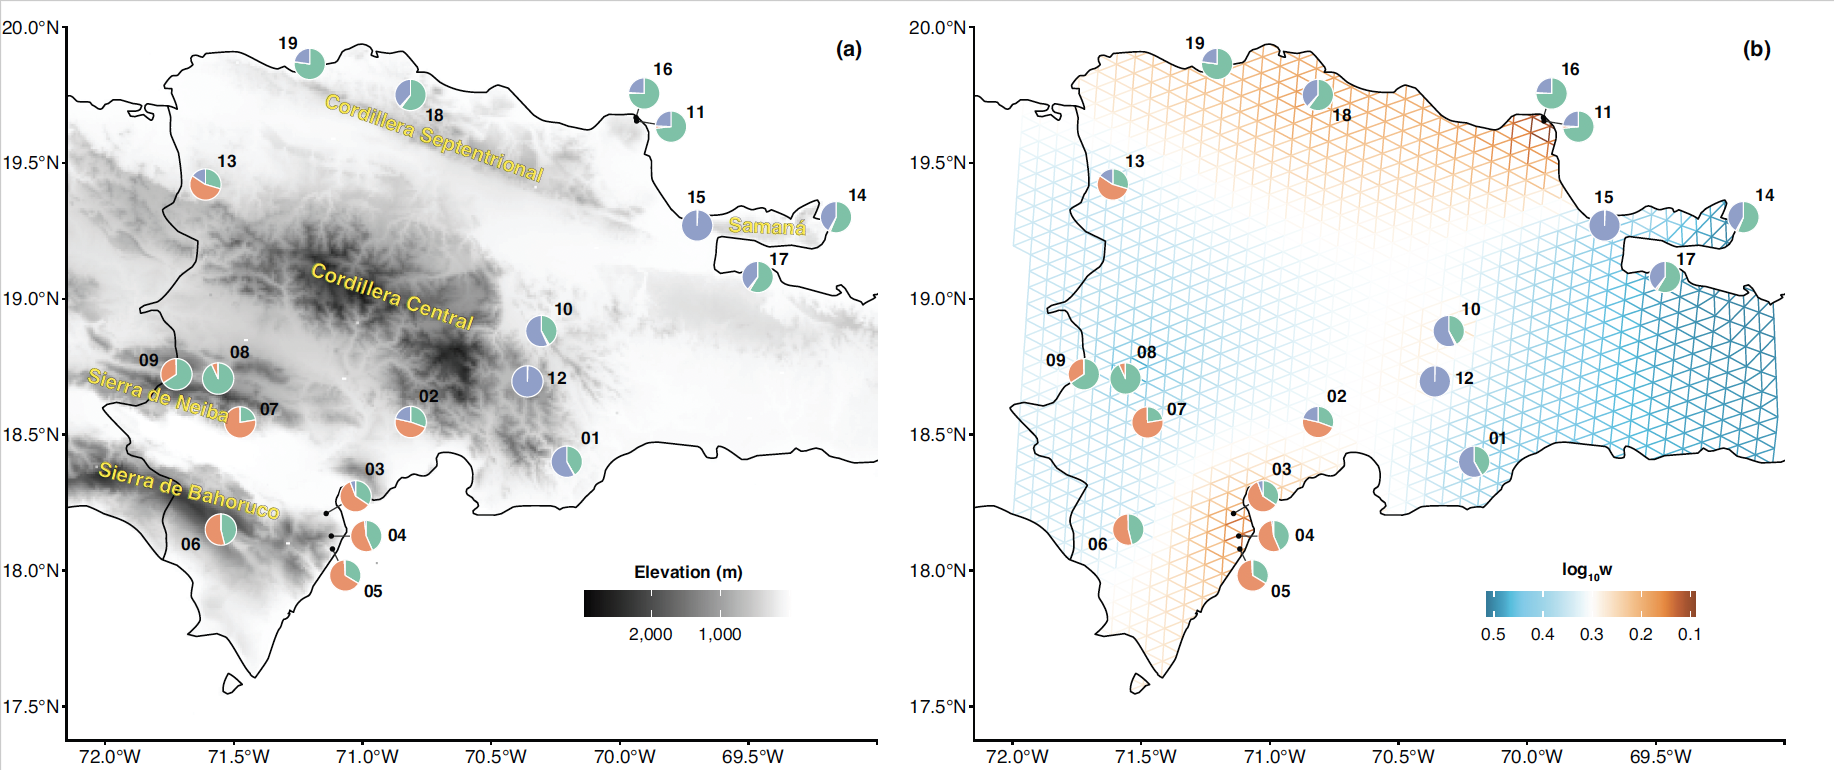
This image Karolis made shows the samples Natalia collected across the Dominican Republic for her paper. Pie charts are labelled with sample numbers and show the proportion of each layer inferred to have contributed to the ancestry of each sample based on the conStruct analysis. (a) Darker areas correspond to higher elevations, with major mountain ranges labeled. (b) The Fast Estimation of Effective Migration Surfaces (FEEMS) analysis. Warmer colors correspond to areas inferred to have less gene flow.
Processing next-generation sequencing data
The lab has several projects that involve developing novel programs to process and analyze genomic data. This includes Miles’ work on assembly, which can be found here, and Eric’s work on analyzing dataset quality.
Urban Ecology and Evolution
This is early work being led by Shawn. Specifically, it examines how a major urban environment may apply selective pressures on the species that grow in it.